Analytics
Conversations and the agent
Volume, quality and the agent's results
How many conversations came in, how the agent handled them, what came of it and what it cost.
Open the page in the dashboardHow the page works
The page answers four questions for your period (default: this month): how many conversations came in, how the agent handled them, what came of them, and what they cost.
The agent's sales here are the “The agent” share of Capi revenue for the same period, so they always match the revenue page.
The agent's key figures
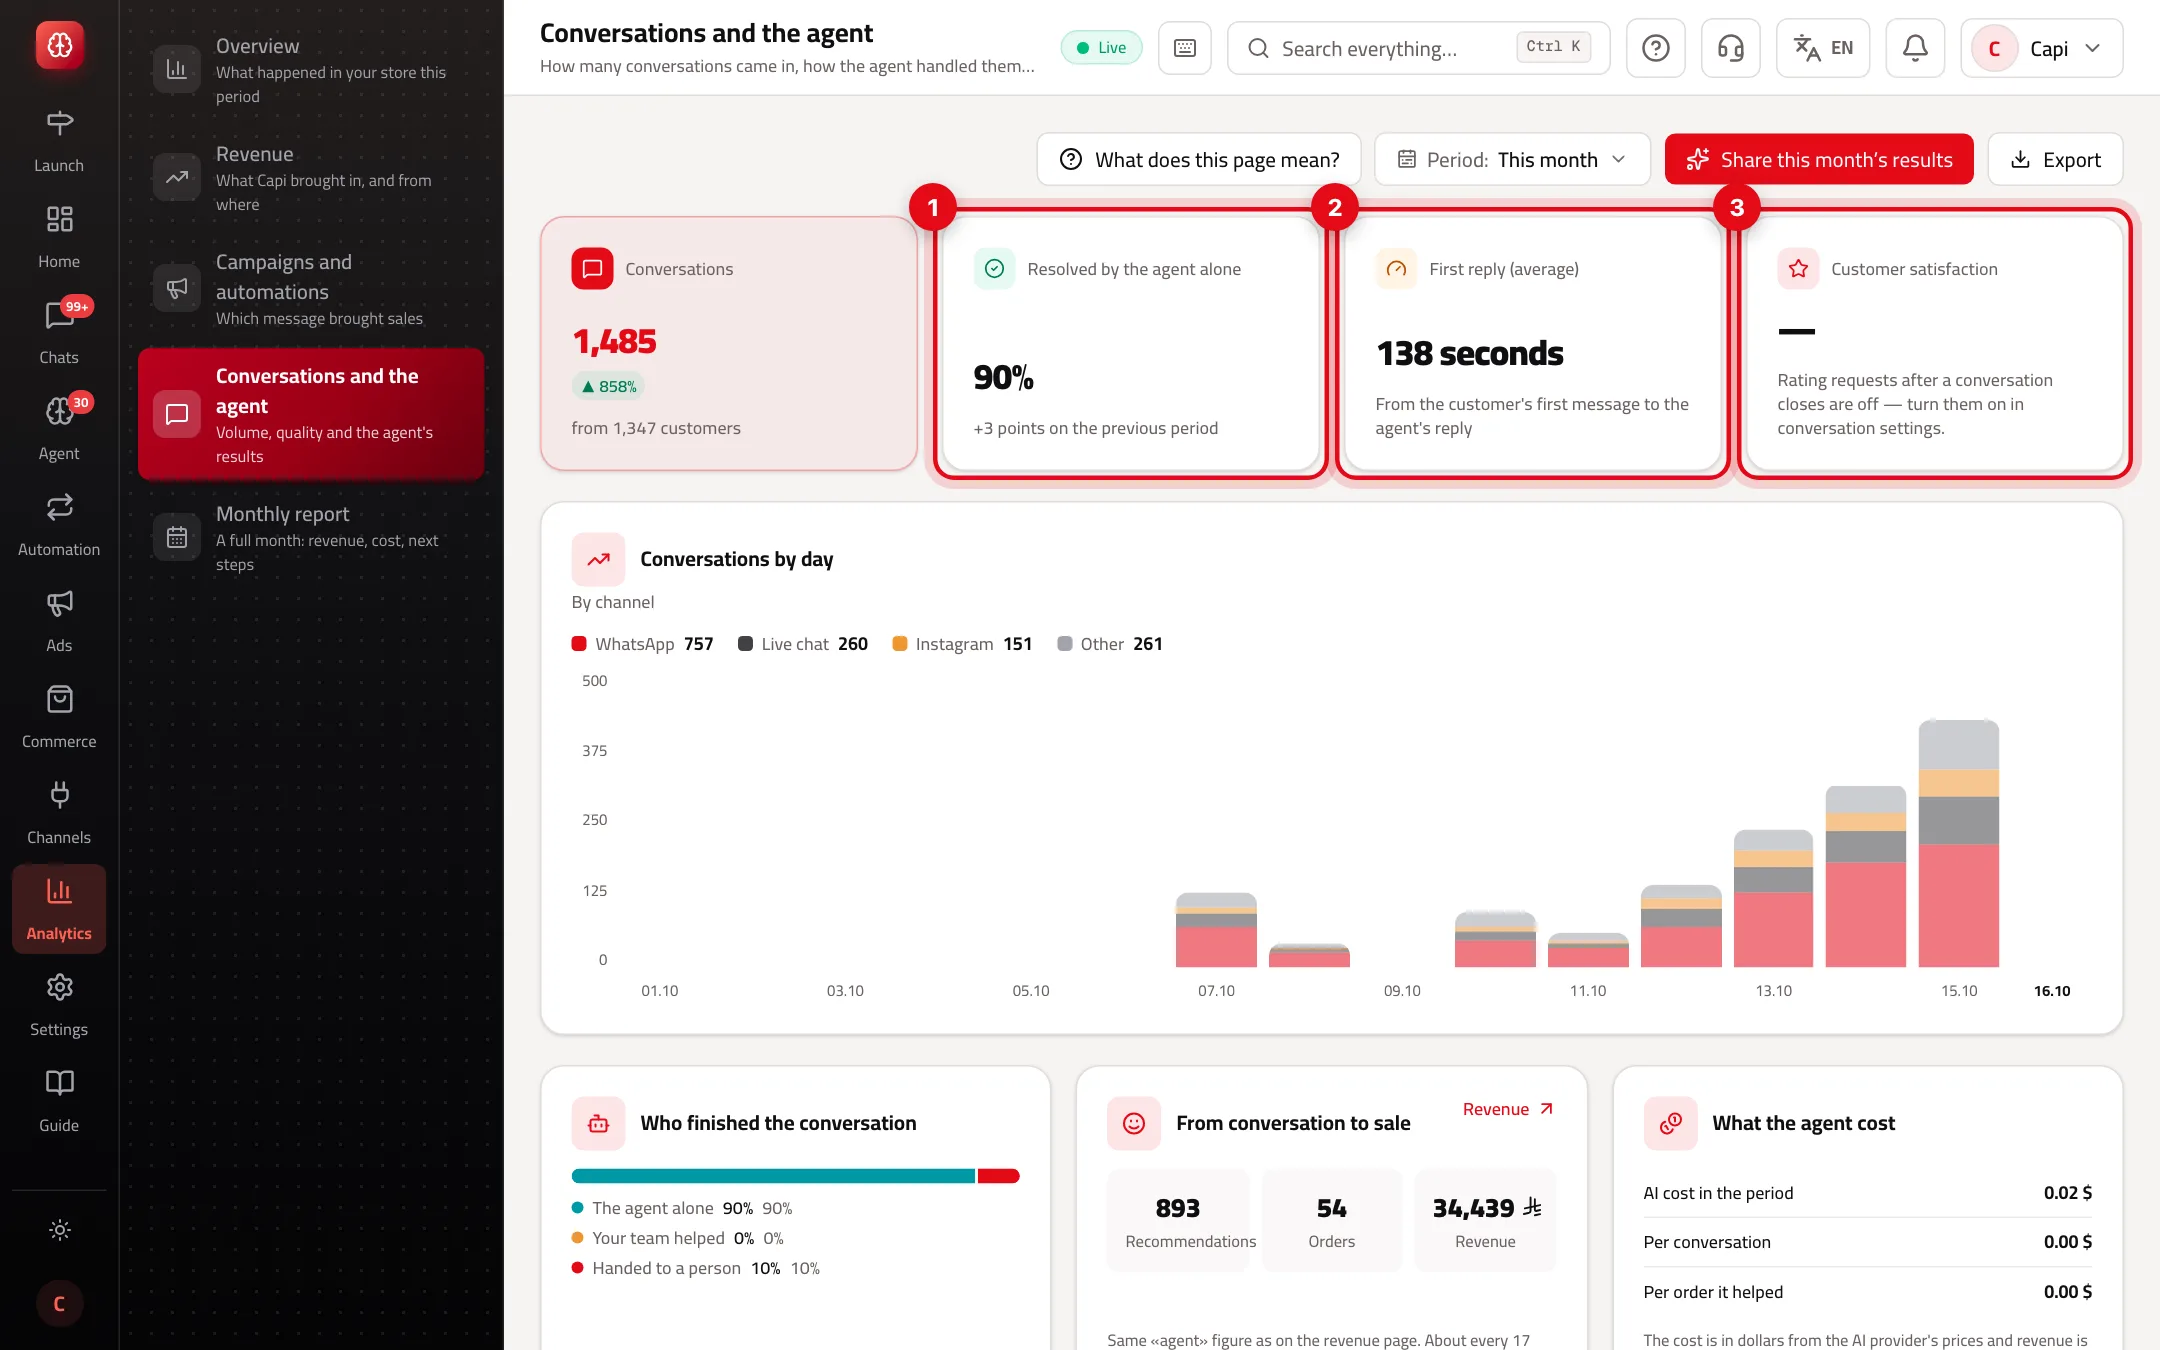
- 1“Resolved by the agent alone”: the share of conversations no one on your team wrote in, and the change in points.
- 2“First reply (average)”: from the customer's first message to the agent's reply.
- 3“Customer satisfaction”: the average post-chat rating and how many ratings. If rating requests are off, it shows “—” with the reason.
Read the agent's performance top to bottom
- 1
Volume
“Conversations” gives the count and from how many customers. “Conversations by day” splits it by channel: the three busiest in colour, the rest as “Other”. A period longer than 92 days shows its last 92 days.
- 2
Who finished, what sold, what it cost
Three cards side by side under the chart.
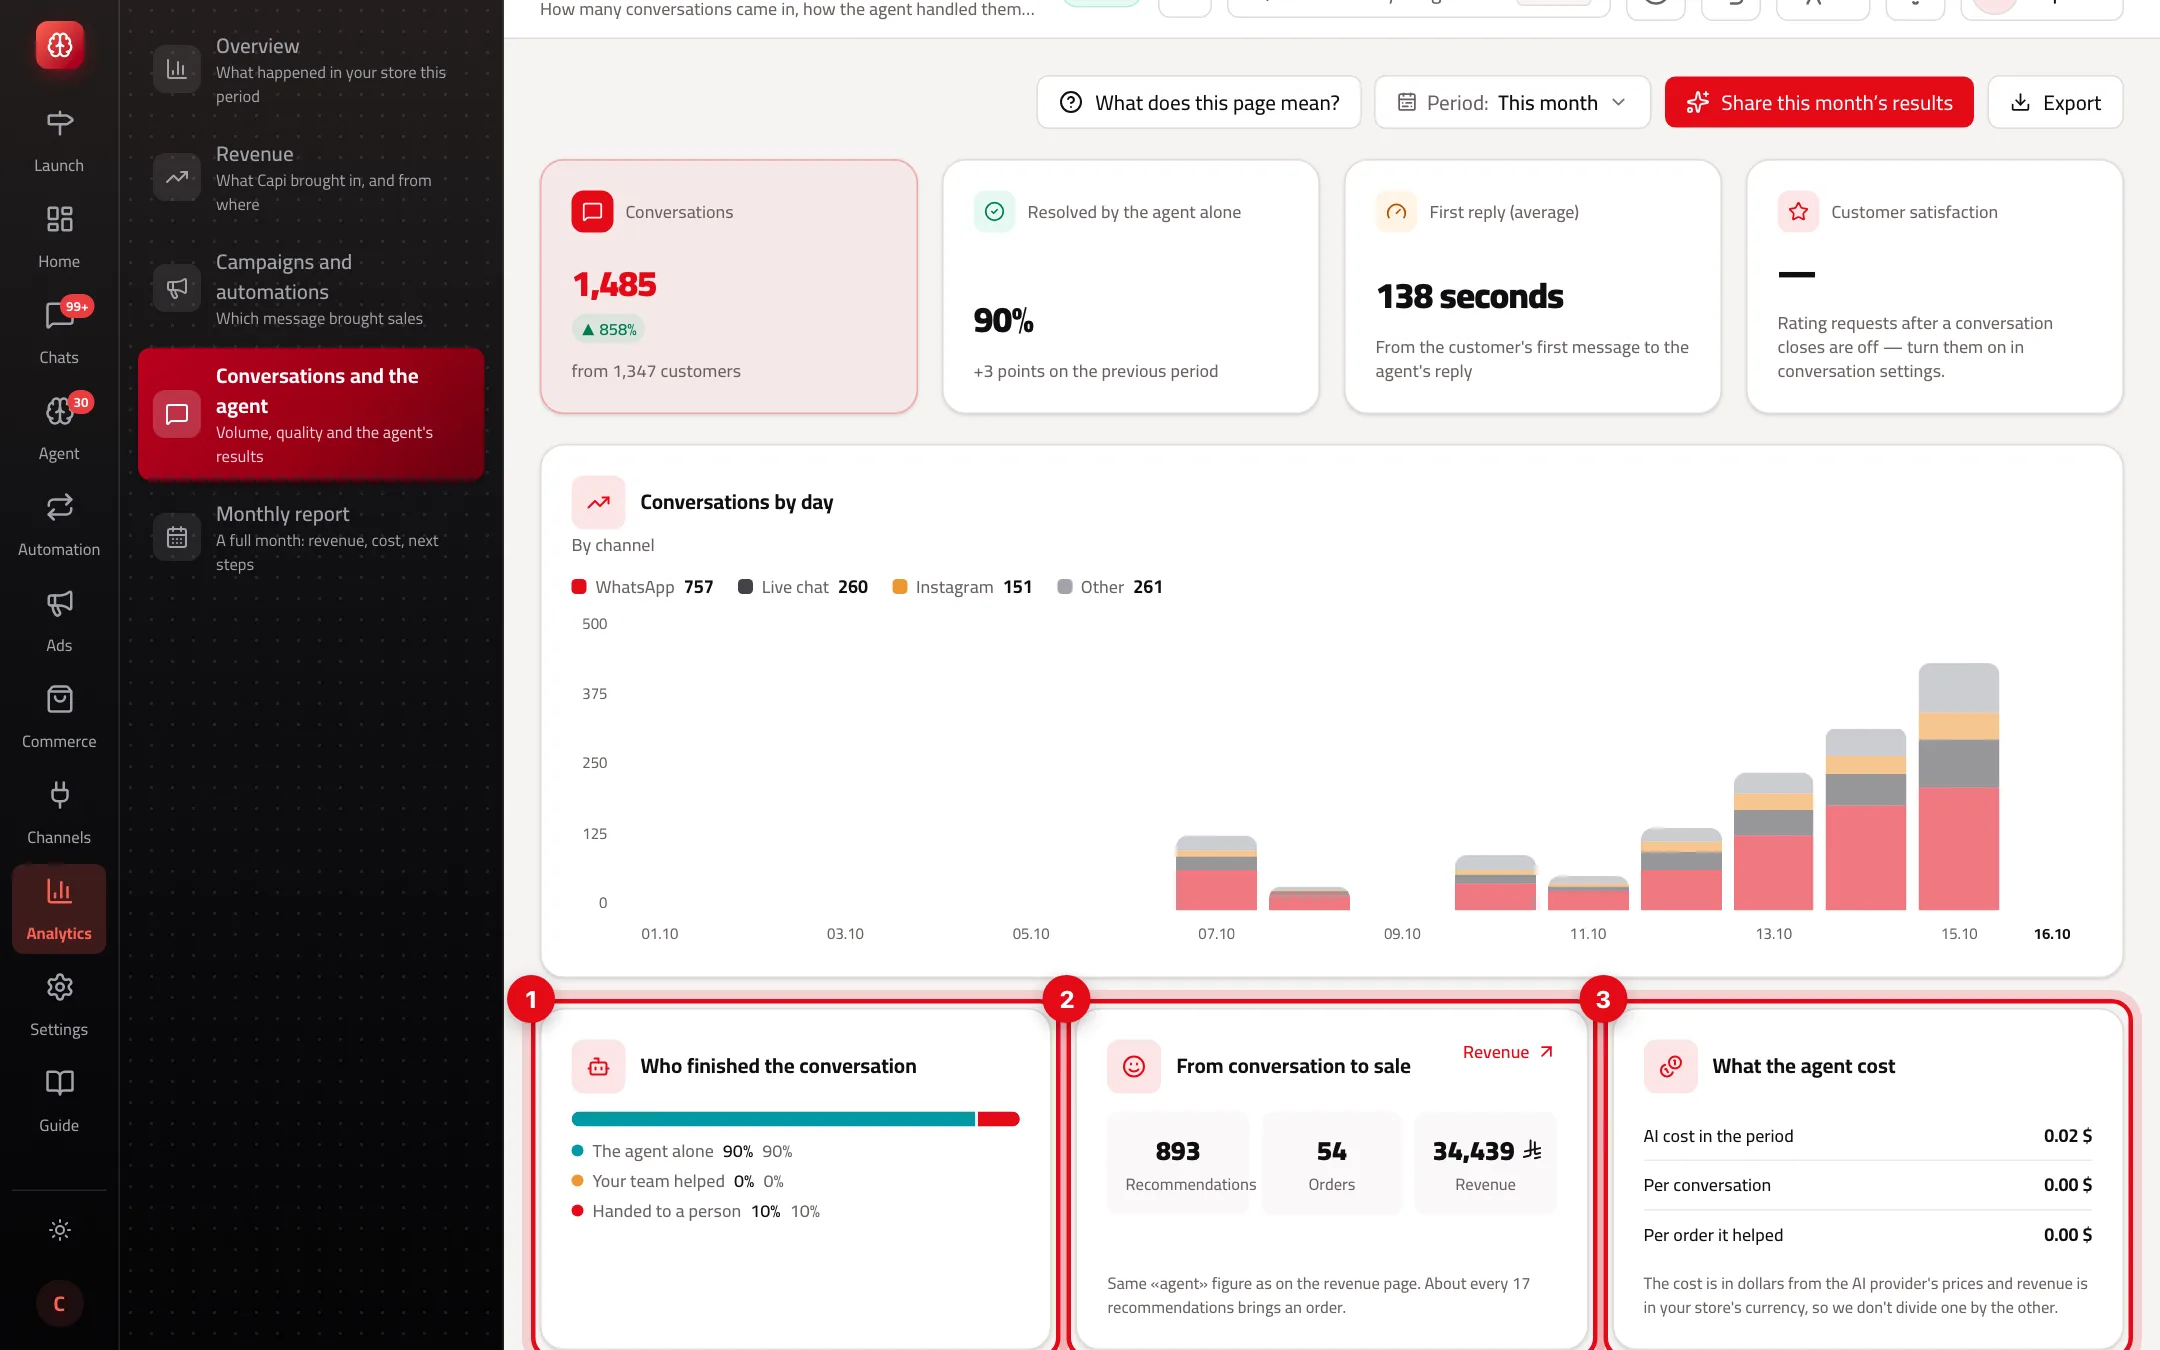
- 1“Who finished the conversation”: the agent alone, your team helped, or handed to a person.
- 2“From conversation to sale”: recommendations, orders where the customer bought a product the agent recommended, and their revenue.
- 3“What the agent cost”: AI cost in the period, per conversation and per order it helped.
- 3
Unanswered questions
“Questions it had no answer for” lists the three asked most. Press “Answer” to add it once — the agent then always knows.
- 4
How customers felt
From their ratings: happy (4–5), neutral (3), unhappy (1–2), with complaints recorded and hand-overs to a person.
- 5
By agent and channel
“By agent” shows each agent name with its channel: conversations, resolved alone, handed over and rating. One engine — the names are per channel. Below: devices (site widget chats only) and channel growth by month over the last 6 months.
What each figure means
| Figure | How it's counted | When no number shows |
|---|---|---|
| Resolved by the agent alone | Conversations with no staff message ÷ all conversations in the period | No conversations: “Not measured” |
| Your team helped | Staff wrote, without a formal hand-over | — |
| Handed to a person | Conversations the agent escalated to your team | — |
| Revenue in “From conversation to sale” | Value of the recommended products in the orders | No orders: a real zero |
| What the agent cost | AI cost in dollars from the provider's prices | No usage: “—” |
Cost is in dollars and revenue in your store's currency, so one is never divided by the other.
Improving the agent
- 84% resolved alone means your team stepped into 16 of every 100 chats. Read those to see what the agent is missing.
- Start each week with “Questions it had no answer for”. Every answer cuts hand-overs.
- Many recommendations but few orders? The suggested products don't fit — check descriptions and stock.
- Turn on rating requests after a chat closes (conversation settings) to see “Customer satisfaction”.
- “Share the month's win” at the top makes an image with the month's real figures to share.
Common misreadings
Problem“Customer satisfaction” is empty although there are chats.
FixRating requests are off, or no one rated yet. The reason is under the tile.
ProblemDevices show fewer than the conversations.
FixThe device is recorded for site widget chats only, not WhatsApp or Instagram.
ProblemA staff member wrote, so it's “Handed to a person”.
FixNo — it shows under “Your team helped”. “Handed to a person” is only for chats the agent escalated.
Screenshot from a demo store
Parts of the page
- 1
Resolved by the agent alone
Conversations no one on your team wrote in.
Example84% means your team stepped in on 16 conversations in every 100. - 2
From conversation to sale
Orders where the customer bought a product the agent recommended — the same figure as on the revenue page.
- 3
What the agent cost
AI cost in dollars at the provider's prices. We don't divide revenue by it because the two currencies differ.
Related articles
Didn't find your answer?