Analytics
Campaigns and automations
Which message brought sales
Every marketing message you sent in one table: campaigns and automations, what was delivered, read and clicked, and what it sold.
Open the page in the dashboardHow the page works
Every marketing message you sent in one table: campaigns, automations (abandoned cart, welcome…), custom automations and site popups. For each: how many arrived, were read, had their link clicked, and the orders and revenue after them.
The revenue in each row is its share of “Capi revenue”, so the table always matches the revenue page. An order where the customer bought a product the agent recommended counts for the agent, not the message.
The page is part of advanced analytics in your plan. Default period: “This month”.
The four figures and how to split
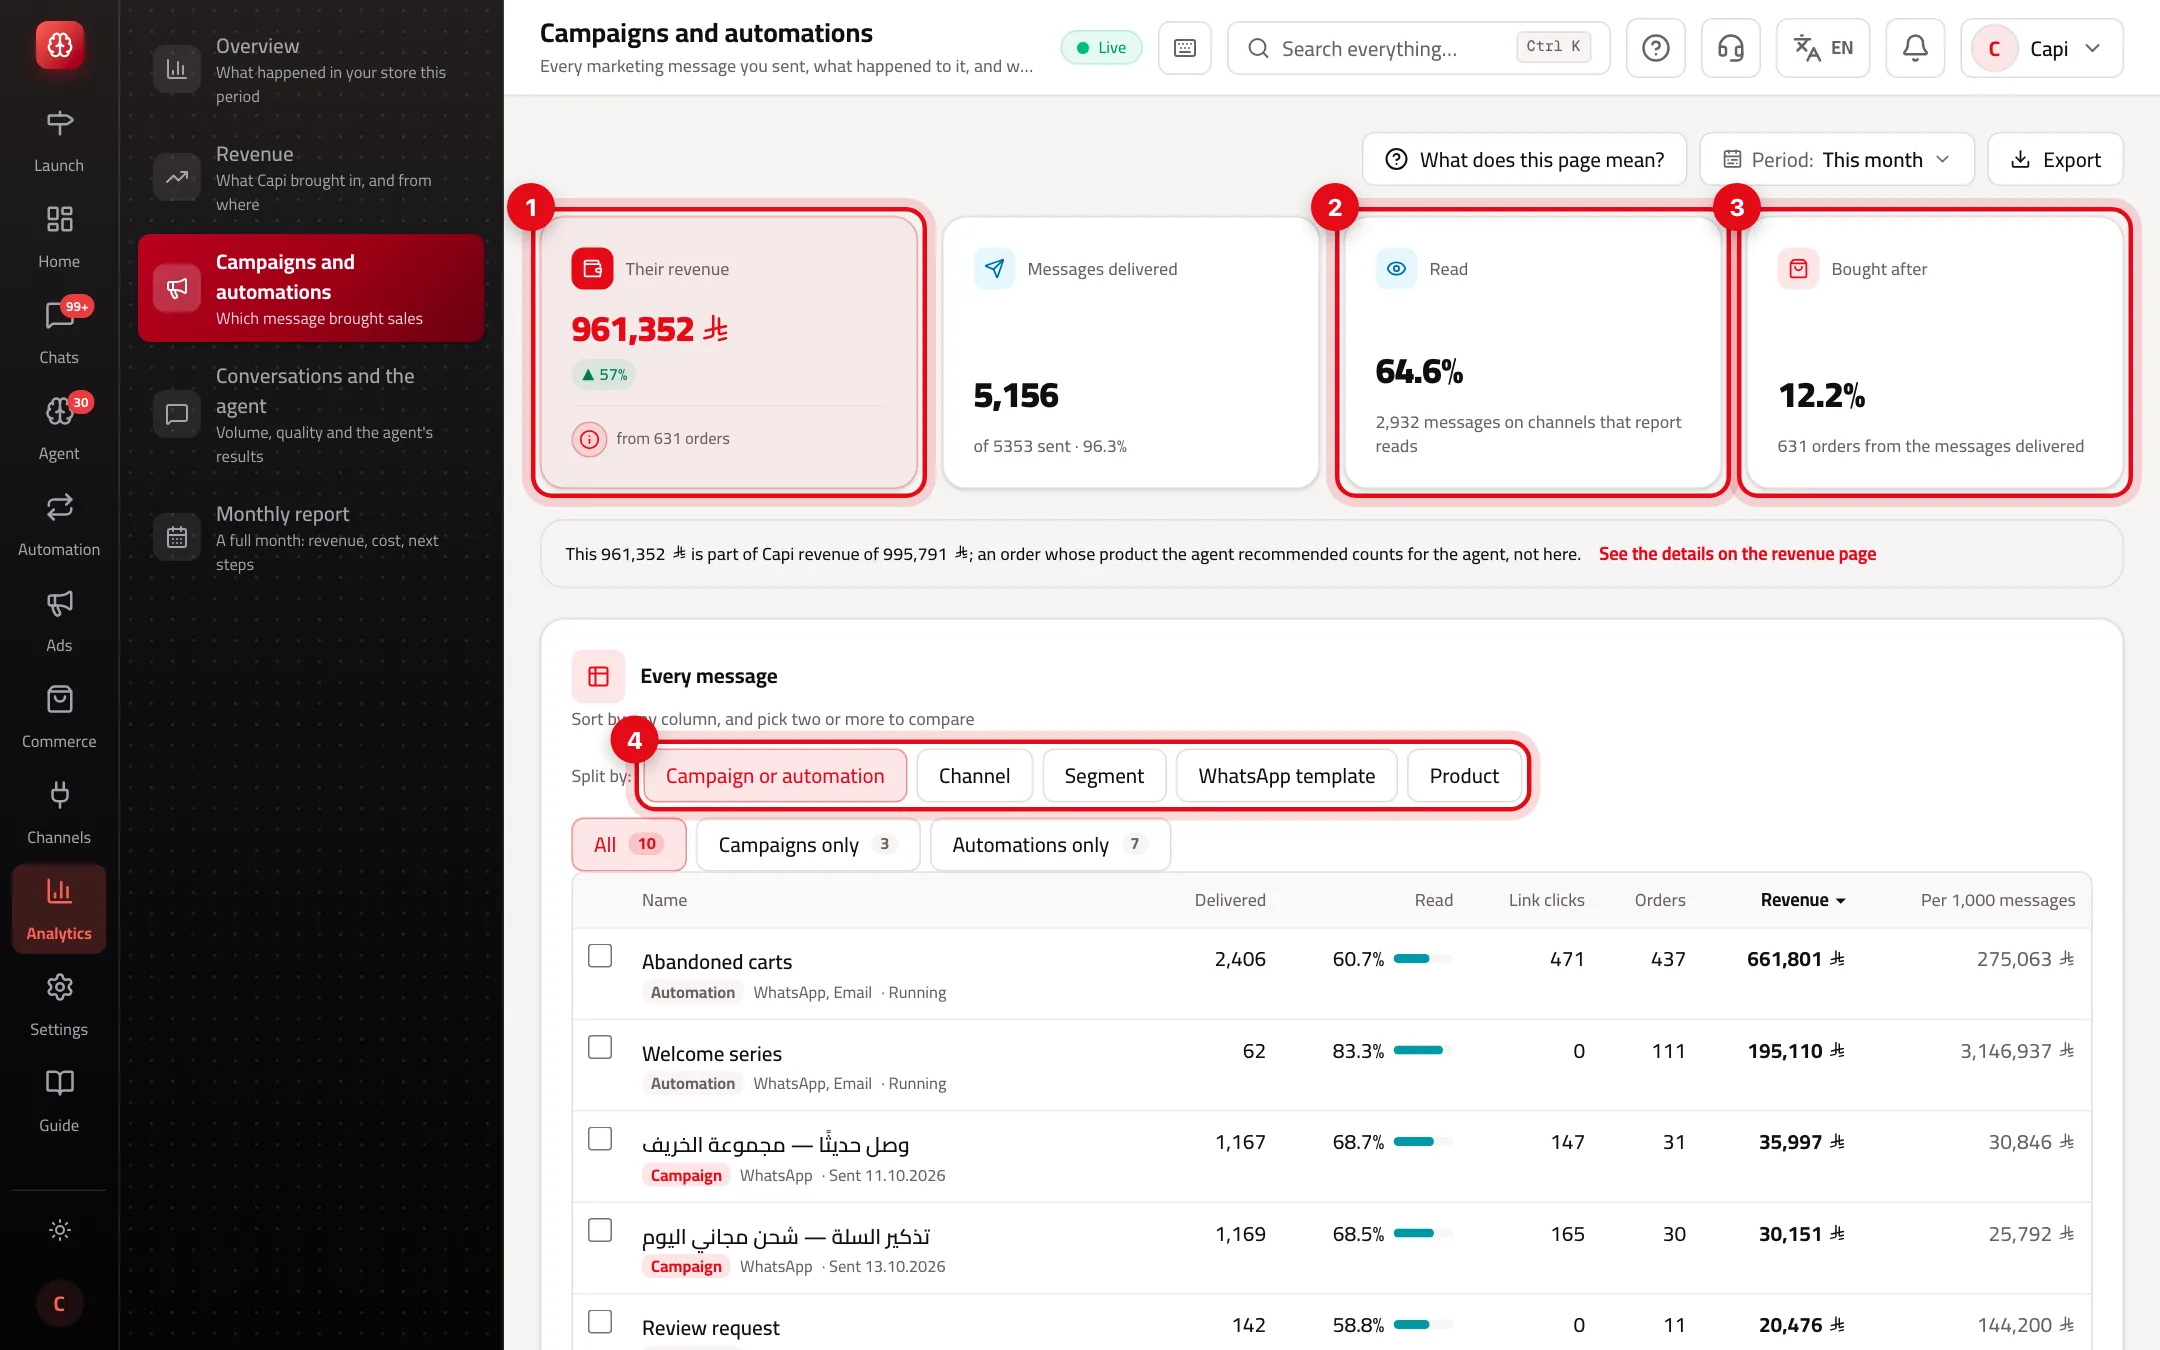
- 1“Their revenue”: campaigns' and automations' share of Capi revenue, with the order count.
- 2“Read”: the read share of messages, on channels that report reads only.
- 3“Bought after”: credited orders ÷ messages delivered.
- 4“Split by”: campaign or automation, channel, segment, WhatsApp template or product.
The table's columns
| Column | Meaning | Note |
|---|---|---|
| Delivered | Messages the channel confirmed as delivered | The “Messages delivered” tile also shows how many were sent and the share |
| Read | Share of messages read | Only on channels that report reads; otherwise “—” |
| Link clicks | Clicks on the message's links | An approved WhatsApp template fixes its button link at approval, so those clicks can't be measured |
| Orders | Orders credited to this message | Each order once, for the strongest evidence |
| Revenue | The message's share of Capi revenue | The column adds up to the campaigns-and-automations share on the revenue page |
| Per 1,000 messages | Revenue ÷ messages delivered × 1,000 | Compares a small reminder with a large campaign fairly |
Compare two messages and see which wins
- 1
Sort the table
Click any column heading to sort by it. For a fair comparison, sort by “Per 1,000 messages”.
- 2
Pick messages
Tick two or more (up to 4) and press “Compare selected”. A “Comparison” card shows them side by side above the table; “Clear comparison” closes it.
- 3
Read Capi's suggestions and the counting rule
At the bottom are “Capi suggests” and “How a purchase is counted”.
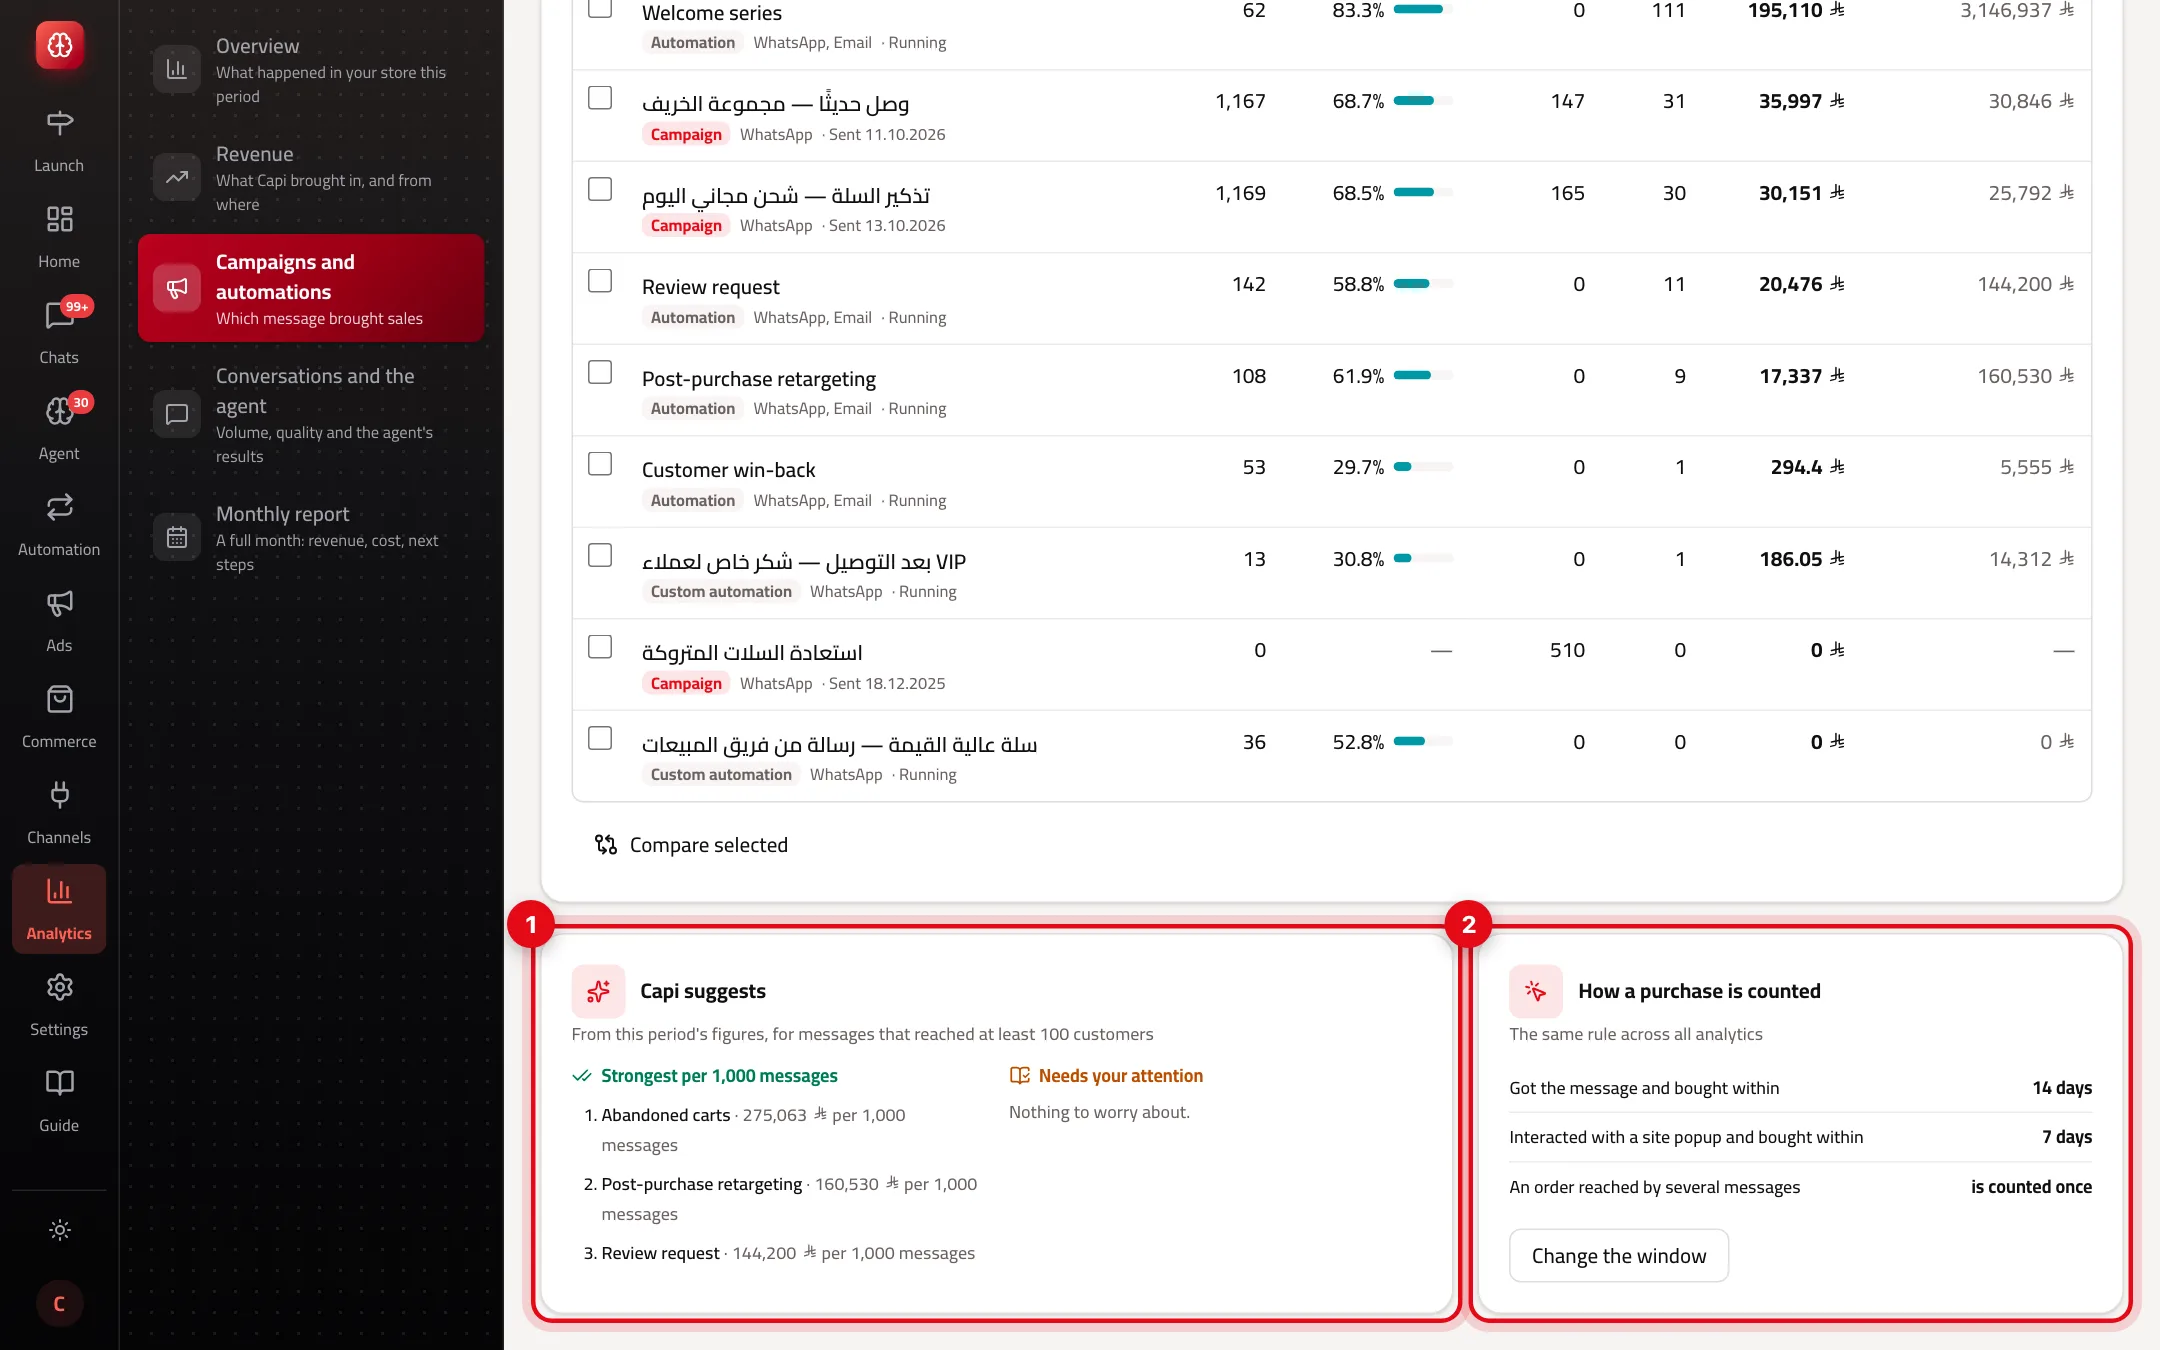
- 1“Capi suggests”: the strongest per 1,000 messages and what needs your attention — only for messages that reached at least 100 customers.
- 2“How a purchase is counted”: your store's current window, with “Change the window”.
What shows under “Needs your attention”
Weak reads
- What it is
- Under 40% of the message was read.
- When to use it
- On a channel that reports reads, after at least 100 messages.
- How to start
- Try a shorter text or another send time.
No orders
- What it is
- Reached 500 or more customers with no order.
- When to use it
- When the sample is big enough to judge.
- How to start
- Review the offer and the audience, or stop the message.
Changing the attribution window
“Change the window” sets two windows: after a message (default 14 days) and after a site popup (default 7 days). Each is 1–90 days, and the click window is always shorter. The change recalculates every analytics page, the revenue page included.
Reading the results
- Compare by “Per 1,000 messages”, not total revenue: a campaign to ten thousand customers always brings more than a small reminder — that doesn't make it better.
- Split by “WhatsApp template” to see which template sells, and reuse it.
- Split by “Product” to see what your messages sell, and focus on those next time.
- A longer window makes numbers bigger but credits purchases far from the message. Change it only if your buying cycle is really longer, like furniture.
Common misreadings
ProblemLink clicks are zero on a WhatsApp campaign.
FixAn approved WhatsApp template fixes its button link when Meta approves it, so its clicks can't be measured. Orders and revenue still are.
Problem“Read” shows “—”.
FixThe channels used don't report reads. That isn't zero.
ProblemThe messages' revenue is less than Capi revenue.
FixRight: Capi revenue also includes the agent and hand-recorded sales. The line above the table shows both amounts.
Screenshot from a demo store
Parts of the page
- 1
A message's revenue
Its share of Capi revenue, so the table adds up to the revenue page. An order whose product the agent recommended counts for the agent, not the message.
ExampleA reminder arrived, then the customer bought a product the agent recommended: it counts for the agent. - 2
Per 1,000 messages
Revenue divided by the messages delivered. It compares a small reminder with a large campaign fairly.
- 3
Comparison
Pick two or more messages in the table and select “Compare selected” to see their figures side by side.
Playbooks that use this page
Related articles
Didn't find your answer?