AI agent
Tool health
Tool performance from real conversations
Tool health from real conversations: confidence, failure rate, latency, and trends for every tool the agent uses.
Open the page in the dashboardHow tool health is measured
Every time the agent uses a tool in a real conversation — searching products, tracking an order — its time, result and confidence are recorded. This page covers the last 7 days for every tool used at least 10 times.
A call counts as failed when it ended in an error or returned nothing. Overall health is the share of calls that didn't fail, weighted by each tool's number of calls.
What the numbers mean
| Number | Meaning |
|---|---|
| Failure rate | Errors or empty results ÷ all calls |
| Avg. confidence | How sure the agent is about the tool's result. Below 50% is low |
| P95 latency | 95% of calls are faster than this |
| Needs attention | Failure rate above 20% or average confidence below 50% |
| Trend | Compares the first and second half of the window: “Degrading” if failures rose by more than 10 points, “Improving” if they fell by more than 10 |
Read the Tool health page
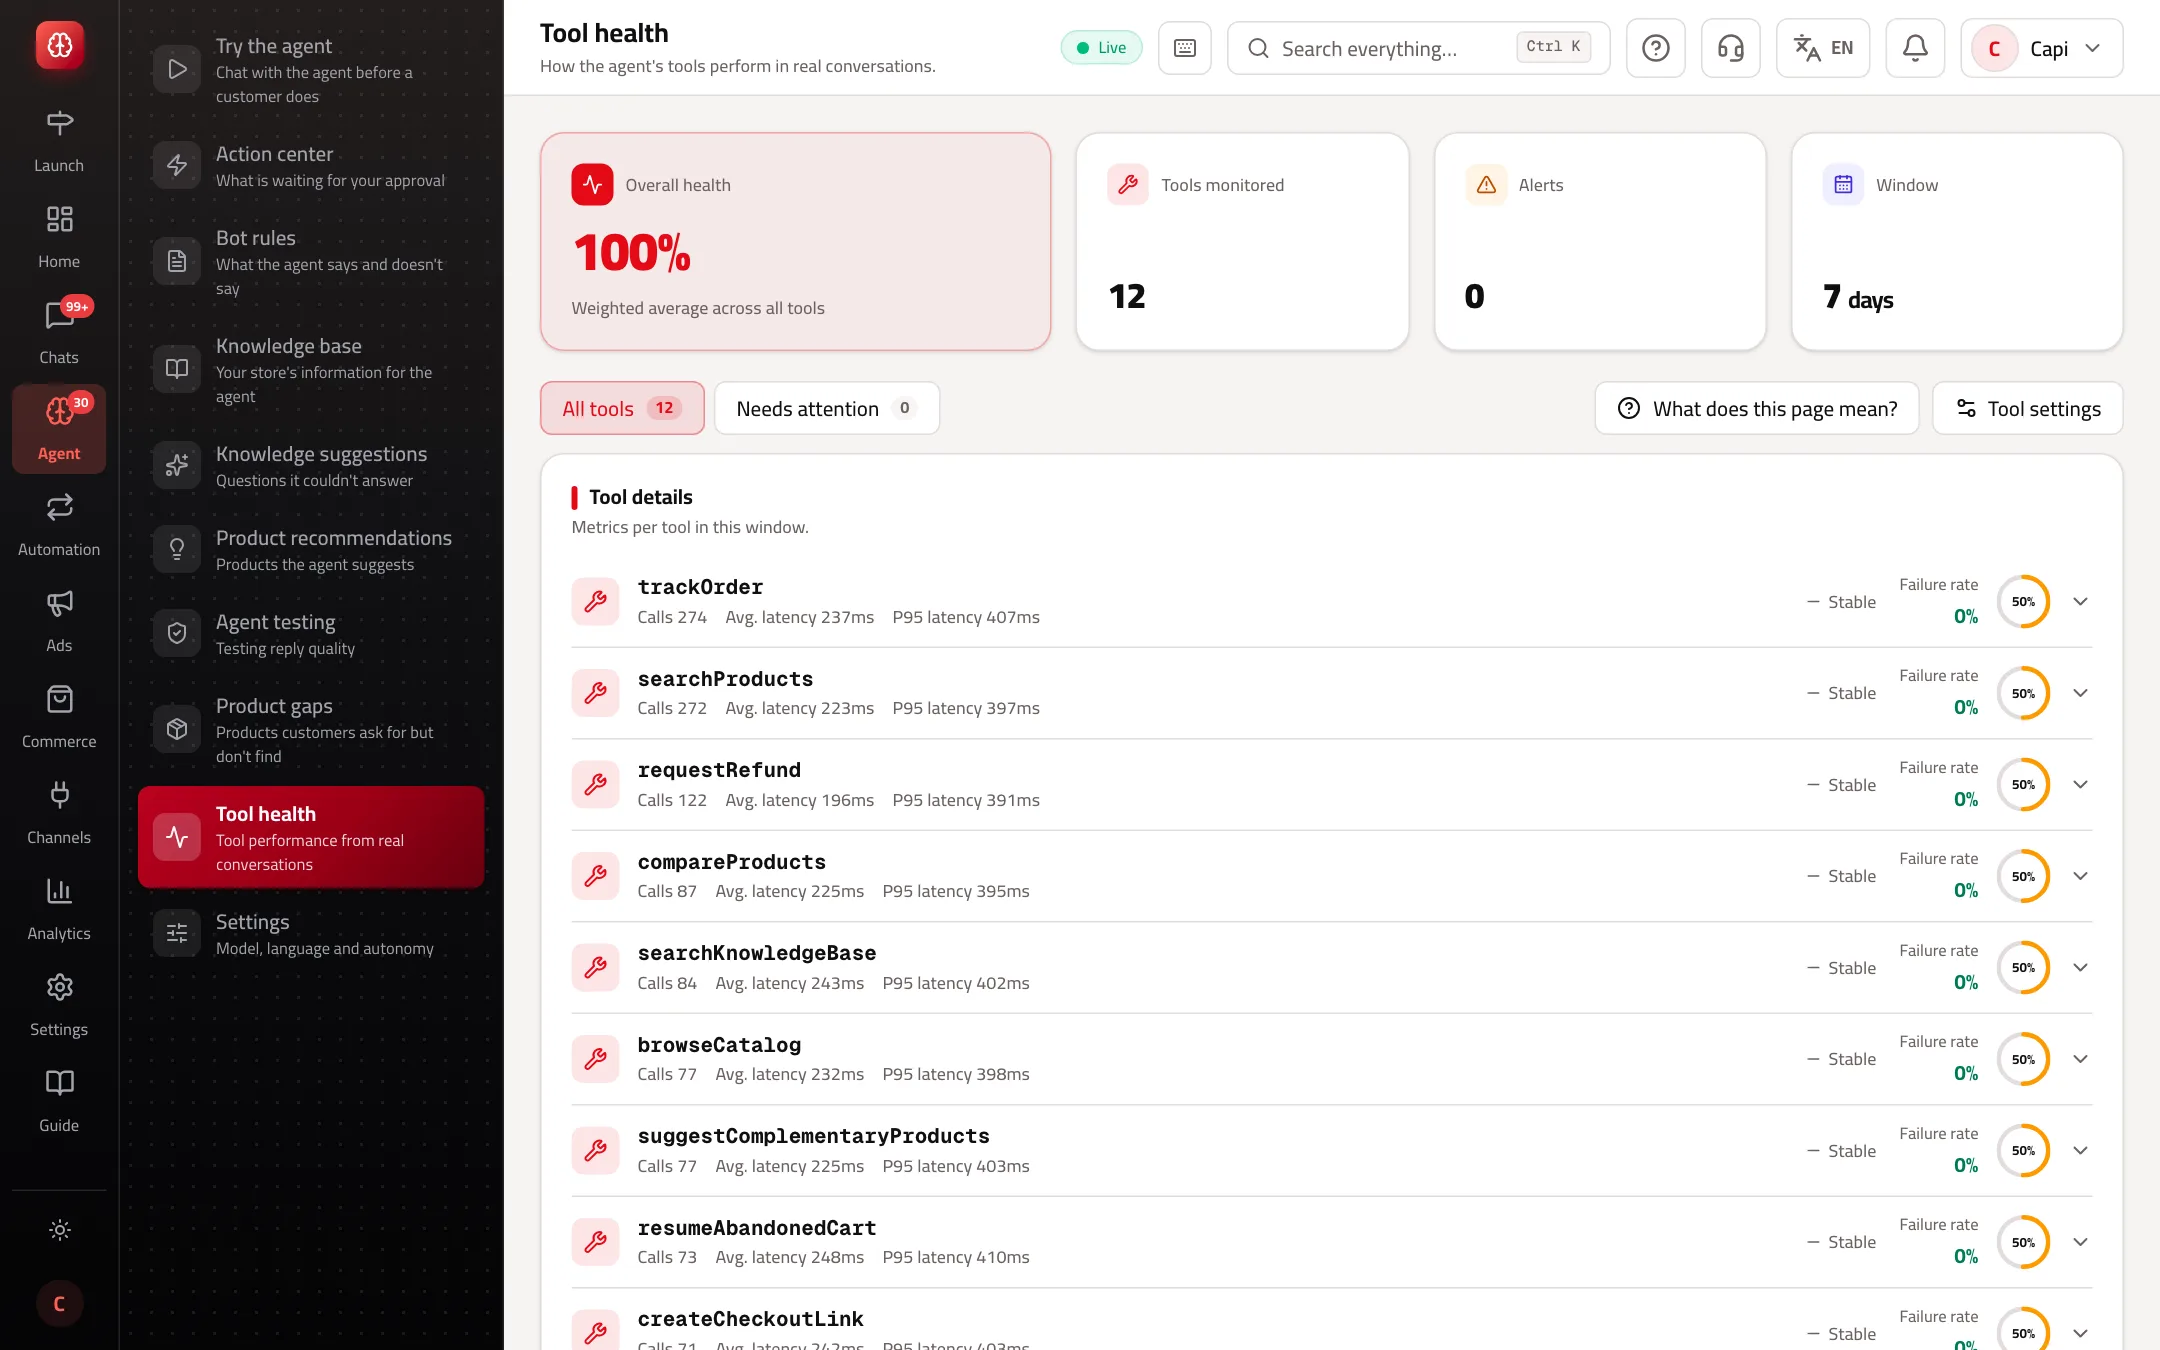
- 1Overall health, tools monitored, alerts and the window.
- 2A tool's row: calls, latency, trend and failure rate. The arrow opens the details.
Best practices
- Open the “Needs attention” tab first, then “Details” to see the “Most common error”.
- Failing product searches usually mean customers ask for what you don't sell, or in words not in your catalog; check Product gaps.
- Low confidence in knowledge-base search means unanswered questions; answer them in Knowledge suggestions.
- A sudden failure in order tracking that used to work usually points to your store connection; check the connection page.
Common mistakes and how to fix them
Problem“The agent hasn't called any tool often enough in this window.”
FixA tool shows after 10 calls in 7 days. Numbers appear after more conversations.
ProblemA tool never shows.
FixIt may be off. Open “Tool settings” and check it's enabled.
Screenshot from a demo store
Parts of the page
- 1
Overall health
Weighted average across all tools — confidence minus failures. A drop means something changed.
ExampleOverall health drops from 82% to 68%: the “order_tracking” tool started failing after a platform API change. - 2
Tools needing attention
Tools with >20% failure rate or <50% confidence. Open them first to fix the biggest impact.
ExampleThe “knowledge_base” tool has 45% confidence — the knowledge base needs updating. - 3
Per-tool details
Calls, confidence, failure rate, latency, p95, and trend for each tool. Sort by any column.
ExampleSort by failure rate to see the worst tool first. - 4
Confidence trends
Sparkline per tool showing confidence over time. Improving/stable/degrading badge at a glance.
ExampleThe “search_products” tool trend is improving after the catalog sync fixed missing descriptions.
Related articles
Didn't find your answer?